- TESIGN / RADAR
- SQL to ER Diagram
SQL to ER Diagram
SQL schema to ER diagram, in-browser
WHO USES ITBackend developers · Data analysts · Team leads
Use in the browser
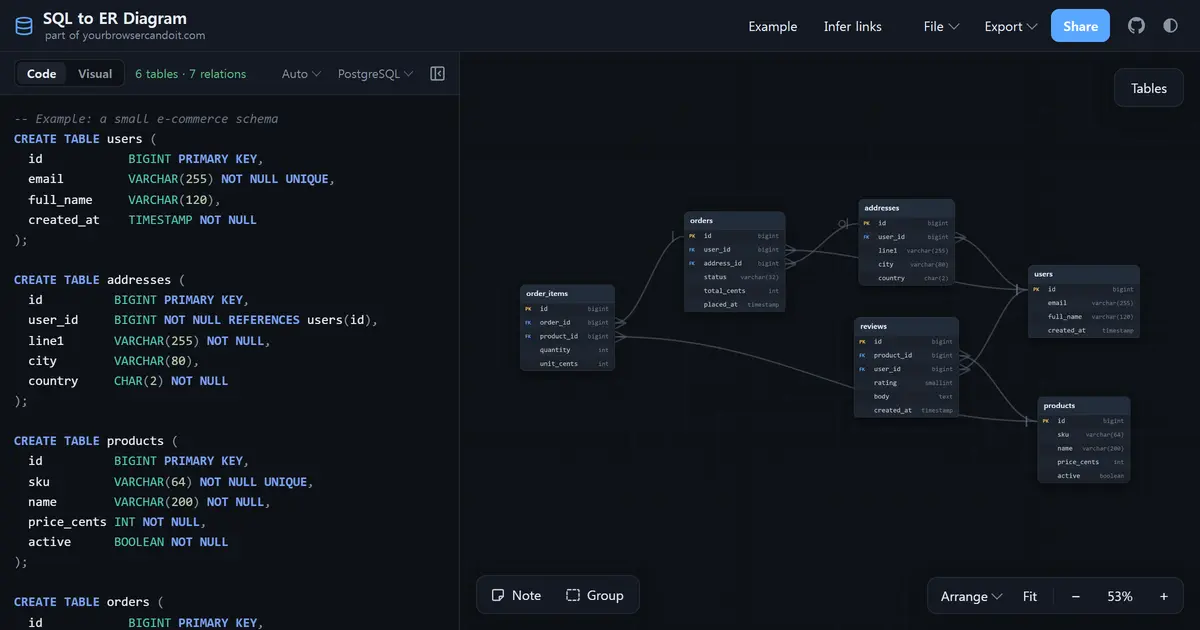
Paste CREATE TABLE DDL, get an interactive ER diagram drawn entirely in your browser
618 stars · checked on GitHub GitHub check 30 h late · no 7-day star increase observed (GH Archive) (as of )
BACK CATALOG
TESIGN TAKE
The design point: the SQL file stays the source of truth, and the diagram is a two-way editor for it.
AT A GLANCE
- LICENSE
- MIT
- USAGE
- Use, change and redistribute, commercially too. Keep the notice.
- LANGUAGE
- HTML
- PLATFORM
- web
- ACTIVITY
- last commit 61 days ago () · no releases
- COMMUNITY
- 2 contributors · 1 open issue (incl. PRs) · made by: an individual
- SOURCES
- GitHub
- OPEN SOURCE
- YES
- FIRST SEEN
- CATEGORY
- DATA · DEV TOOLS
A summary, not legal advice.
WHY IT MATTERS
There is no server, so the schema never leaves the machine, and a share link carries the whole project (SQL, layout, camera, dialect) gzip+base64-encoded in the URL hash. The canvas renderer (cached bitmaps plus viewport culling) was benchmarked at ~120 fps zooming 300 tables and 593 FKs, and double-clicking a table or column name on the canvas writes the change back into the SQL text with comments and formatting preserved. Two dependencies, 32 KB gzip bundle.
BUILD FROM THIS
- dist/ is plain static files, so it can sit on an internal wiki or GitHub Pages as the team's schema page; MIT means you can fork it and add your own SQL dialect parser.
WHO IT'S FOR
- Backend developers
- paste a migration file and check the relationships
- Data analysts
- visualize CTE dependencies of a BigQuery WITH query
- Team leads
- share a schema review as one link, no accounts
START IN 5 MINUTES
# npm install
# npm run dev      # http://localhost:5173
# npm run build    # outputs static files to dist/
# npm run preview  # preview the production build locally
# No install: https://sqltoerdiagram.com
CAVEATS
- MIT. Browser-only app. Per the README the parser covers PostgreSQL, MySQL, SQLite, SQL Server and Snowflake plus a BigQuery mode (the live site also lists Oracle, MariaDB, Prisma, DBML and others, which the README does not). Parsing centres on CREATE/ALTER TABLE with PK, FK and UNIQUE constraints; views, indexes and triggers are not in the supported list. Last push 2026-07-17.
RECEIPT
- FIRST SEEN
- AT SOURCE
- KEPT
- CREATED → FIRST SEEN
- 91d
- SOURCES
- GitHub
- ◌ BACK CATALOG
- Reconstructed from archive data, not a live discovery.
The same facts in machine-readable form — View as Markdown · JSON
SIMILAR TOOLS
Up to five from DATA by ★ total: edited entries first, then repository cards; this entry is highlighted. Drawn from the same stored snapshot as the rankings — a comparison, not a recommendation.
| IMAGE | NAME | ★ TOTAL | ▲ 7d | LICENSE | PLATFORM | LAST PUSH |
|---|---|---|---|---|---|---|
 | gods-eye-viewLive satellite globe in your browser | ★ 34.8k | ▲ +2,468 | Licence unconfirmedunconfirmed | web · windows · macos · linux | |
 | SQL to ER DiagramSQL schema to ER diagram, in-browserTHIS ENTRY | ★ 618 | — | MITpermissive | web | |
| grafana/grafanaCARD | ★ 76.7k | ▲ +4 | AGPL-3.0copyleft | — | ||
| calcom/cal.diyCARD | ★ 48.4k | ▲ +10 | MITpermissive | — | ||
| umami-software/umamiCARD | ★ 38.8k | ▲ +4 | MITpermissive | — |
ALSO WORTH SEEING
TIMELINE
- Repository created
- FIRST SEEN BY TESIGN ◌ BACK CATALOG